


2018 World Hunger and Poverty Facts and Statistics
EDITORIAL NOTE!! This is an older version of our fact sheet. To access the latest information, please see 2022 United States Hunger Facts and Statistics and Hunger Notes Basics: Understanding Global Hunger
This fact sheet is divided into the following sections:
- Hunger concepts and definitions
- Number of hungry people in the world
- Progress in reducing the number of hungry people
- Children and hunger
- Micronutrients
- Does the world produce enough food to feed everyone?
- Causes of hunger
Hunger concepts and definitions
Hunger defines a short-term physical discomfort as a result of chronic food shortage, or in severe cases, a life-threatening lack of food. (National Research Council, 2006)
World hunger refers to hunger aggregated to the global level. Related terms include food insecurity and malnutrition. Food insecurity refers to limited or unreliable access to foods that are safe and nutritionally adequate (National Research Council, 2006). Malnutrition is a condition resulting from insufficient intake of biologically necessary nutrients (National Research Council, 2006). Although malnutrition includes both overnutrition and undernutrition, the focus for global hunger is undernutrition.
There are two basic types of malnutrition/undernutrition. The first and most important is protein-energy malnutrition (PEM), or a lack of calories and protein. Food is converted into energy by humans, and the energy contained in food is measured by calories. Protein is necessary for key body functions, including the development and maintenance of muscles. Protein-energy malnutrition is the more lethal form of malnutrition/hunger and is the type of malnutrition that is referred to when world hunger is discussed. This leads to growth failure. Principal types of growth failure are:
- Based on physical measurements, like weight, malnutrition can be broken down into moderate acute malnutrition (MAM) and severe acute malnutrition (SAM), with SAM being worse (Black et al., 2016).
- There are two types of acute malnutrition. Wasting (also called marasmus) is having a very low weight for a person’s height. Nutritional edema (also called kwashiorkor) is swollen feet, face or limbs (UNICEF, 2015). See visual illustrations here.
- Stunting is being too short for a person’s age. It is a slow, cumulative process and develops over a long period as a result of inadequate nutrition or repeated infections, or both. Stunted children may have normal body proportions but look younger than their actual age.
Source: UNICEF/WHO/The World Bank, Levels and Trends in Child Malnutrition, 2018, p. 3
The second type of malnutrition is micronutrient (vitamin and mineral) deficiency. This is not the type of malnutrition that is referred to when world hunger is discussed, though it is certainly very important. Specific examples of micronutrient deficiency, such as Vitamin A deficiency, are discussed below. (For more examples see UNICEF Nutrition in Emergencies Lesson 2.1 p 11 and for a good overview of malnutrition topics see all of Lesson 2.)
Take a two-question hunger quiz on this section
Number of hungry people in the world
The United Nations Food and Agriculture Organization (FAO) estimates that about 815 million people of the 7.6 billion people in the world, or 10.7%, were suffering from chronic undernourishment in 2016. Almost all the hungry people live in lower-middle-income countries. There are 11 million people undernourished in developed countries (FAO 2015; for individual country estimates, see Annex 1. For other valuable sources, especially if interested in particular countries or regions, see IFPRI 2016 and Rosen et. al. 2016).

Source: FAO, The State of Food Security and Nutrition in the World, 2017 p. 7
Take a three-question hunger quiz on this section.
Progress in reducing the number of hungry people
The vast majority of hungry people live in lower-middle-income regions, which saw a 42 percent reduction in the prevalence of undernourished people between 1990–92 and 2012–14. Despite this progress, in 2016, the global prevalence of undernourishment has been rising (Food and Agricultural Organization [FAO] et al., 2017). Africa has the highest prevalence of undernourishment, but as the most populous region in the world, Asia has the highest number of undernourished people (FAO et al., 2017). Prevalence is the proportion of a population affected by a disease or showing a certain characteristic (expressed as a percentage), and number is simply the count of people in the population with a disease or showing a certain characteristic.
- There has been the least progress in the sub-Saharan region, where about 23 percent of people remain undernourished – the highest prevalence of any region in the world. Nevertheless, the prevalence of undernourishment in sub-Saharan Africa has declined from 33.2 percent in 1990– 92 to 23.2 percent in 2014–16, although the number of undernourished people has actually increased (FAO et al., 2017).
- In Southern Asia, which includes the countries of India, Pakistan and Bangladesh, the prevalence of undernourishment is rising again, increasing from 9.4 percent in 2015 to 11.5 percent in 2016 (FAO et al., 2017). Eastern Asia (where China is the largest country) and South-eastern Asia (including Indonesia, Philippines, Myanmar, Vietnam) have reduced undernutrition substantially.
- Latin America has the most successful developing region record in increasing food security; however, the prevalence of undernutrition has been rising again, especially in South America, from 5 percent in 2015 to 5.6 percent in 2016 (FAO et al., 2017).
2015 marked the end of the monitoring period for the two internationally agreed targets for hunger reduction. The target for the Millennium Development Goals for lower-middle-income countries as a whole was to halve the proportion of hungry people by 2015 from the base year(s) of 1990-2, or from 23.2 percent to ll.6 percent. As the proportion in 2014-16 is 12.9 percent, the goal has almost been met. Following the Millennium Development Goals, the Sustainable Development Goals aim to end all forms of malnutrition by 2030 (FAO et al., 2017).
World Food Summit target. The target set at the 1996 World Food Summit was to halve the number of undernourished people by 2015 from their number in 1990-92. Since 1990–92, the number of hungry people in lower-middle-income regions has fallen by over 200 million, from 991 million to 790.7 million. However, the goal is 495 million (half of 991 million), which means that the target was not reached.
(Source: FAO et al, 2015 pp 8-12)
Children and hunger
Children are the most visible victims of undernutrition. It is estimated that undernutrition—including stunting, wasting, deficiencies of vitamin A and zinc, and fetal growth restriction (when a baby does not grow to its normal weight before birth)—is a cause of 3·1 million child deaths annually or 45 percent of all child deaths in 2011 (UNICEF, World Health Organization [WHO], & The World Bank, 2018). Undernutrition magnifies the effect of every disease, including measles and malaria. The estimated proportions of deaths in which undernutrition is an underlying cause are roughly similar for diarrhea (61%), malaria (57%), pneumonia (52%), and measles (45%) (Black 2003, Bryce 2005). Undernutrition can also be caused by diseases, such as those that cause diarrhea, by reducing the body’s ability to convert food into usable nutrients.
From GAIN. https://www.gainhealth.org
Stunting
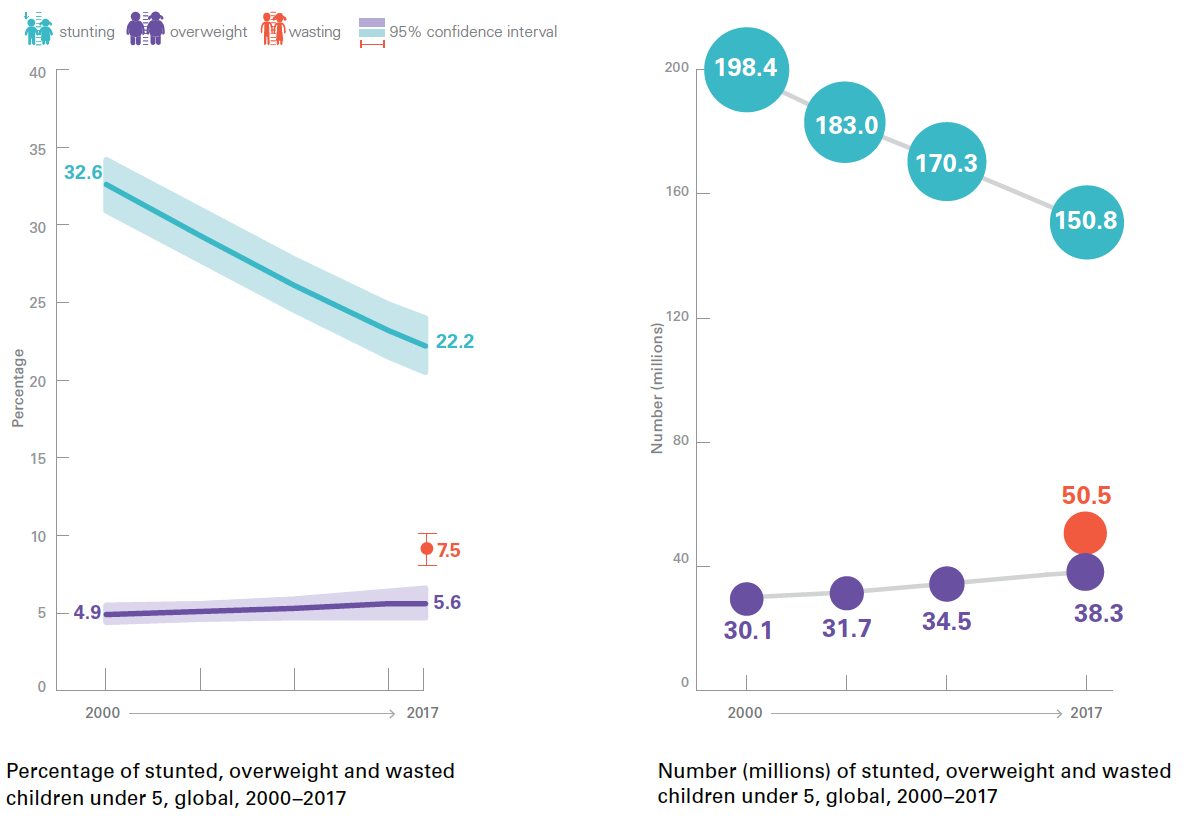
- Globally 150 million under-five-year olds were estimated to be stunted in 2017. (UNICEF, WHO, & The World Bank, 2018).
- The global trend in stunting prevalence and numbers affected is decreasing. Between 2000 and 2017 stunting prevalence declined from 33 percent to 22 percent and numbers declined from 198 million to 150 million (UNICEF, WHO, & The World Bank, 2018).
- In 2017, about half of all stunted children under five years of age lived in Asia and over one-third in Africa (UNICEF, WHO, & The World Bank, 2018).
Wasting and severe wasting
- Globally, 50.5 million under-five-year olds were wasted (or low weight for height) in 2017 (UNICEF, WHO, & The World Bank, 2018).
- Globally, wasting prevalence in 2017 was estimated at almost 8 percent (UNICEF, WHO, & The World Bank, 2018).
- Approximately two-thirds of all wasted children under five years old lived in Asia and over one-quarter in Africa, with similar proportions for severely wasted children (UNICEF, WHO, & The World Bank, 2018).
Take a three-question hunger quiz on this section
Micronutrients
Quite a few trace elements or micronutrients—vitamins and minerals—are important for health. Three very important micronutrient deficiencies in terms of health consequences for people in lower-middle-income countries are:
Iron
- In many lower-middle-income countries, iron deficiency anemia is aggravated by worm infections, malaria and other infectious diseases such as HIV and tuberculosis.
- The major health consequences include poor pregnancy outcome, impaired physical and cognitive development, increased risk of morbidity (illness) in children and reduced work productivity in adults. Anemia contributes to 20 percent of all maternal deaths (FAO, 2017).
Vitamin A
- Vitamin A deficiency can cause night blindness and reduce the body’s resistance to disease. In children, vitamin A deficiency can also impair growth.
- An estimated 250 million preschool children are vitamin A deficient. An estimated 250,000 to 500,000 vitamin A-deficient children become blind every year, half of them dying within 12 months of losing their sight (FAO, 2017).
Iodine
- Iodine deficiency is one of the main cause of impaired cognitive development in children, especially in iodine-deficient areas of Africa and Asia. About 38 million babies are born with iodine deficiency (FAO, 2017).
- Iodine deficiency has a simple solution: iodized salt. Thanks to this intervention, the number of countries where iodine deficiency is a public health problem has been halved over the past decade. However, 54 countries still have a serious iodine deficiency problem. (WHO)
Does the world produce enough food to feed everyone?
The world produces enough food to feed everyone. For the world as a whole, per capita caloric availability and food diversity (the variety of food groups in a diet) have increased between the 1960s and 2011 (FAO, 2017). This growth in food availability, along with improved access to food, helped reduce the percentage of chronically undernourished people in lower-middle-income countries from about 30 percent in the 1990-92 to about 13 percent two decades later (FAO, 2017). A principal problem is that many people in the world still do not have sufficient income to purchase (or land to grow) enough food or access nutritious food. This is an element of “food security”. The FAO defines four dimensions of food security, all of which must be fulfilled simultaneously, for food security to exist. The four dimensions are: 1) physical availability of food, 2) economic and physical access to food, 3) food utilization, and 4) the stability of those other dimensions over time.
What are the causes of hunger?
Poverty is the principal cause of hunger. The causes of poverty include lack of resources, unequal income distribution in the world and within specific countries, conflict and hunger itself. As of 2013, when the most recent comprehensive data on global poverty was collected, about 767 million people are living below the international poverty line of less than $1.90 per person per day (The World Bank, 2016). This was a decrease of about 1 billion people below the poverty line from 1990 (The World Bank, 2016). However, although the number of people living in extreme poverty globally has been declining, in lower-middle-income regions, such as sub-Saharan Africa, the number is actually growing (FAO, 2017).
Hunger is also a cause of poverty, and thus of hunger, in a cyclical relationship. By causing poor health, small body size, low levels of energy and reductions in mental functioning, hunger can lead to even greater poverty by reducing people’s ability to work and learn, thus leading to even greater hunger. See Victoria et al. 2008.
Conflict. More than half (489 million) of the 815 million hungry people in the world live in countries affected by conflict (FAO et al., 2017). Ranging from non-state and state-based violence to one-sided violence, some of the conflicts that result in internal or international displacement have occurred in Syria, Yemen, Somalia, the Democratic Republic of the Congo and Myanmar, among many other countries throughout the world. In addition, most of the 19 countries listed by FAO as countries in complex, prolonged conflict are located in Africa (FAO et al., 2017).
In 2016, the average prevalence of undernourishment in countries undergoing conflict was about four percentage points greater than the prevalence in non-conflict countries (FAO et al., 2017). About 75 percent of children in the world who are stunted live in conflict areas (FAO et al., 2017).
Conflict in rural areas interferes with food and agriculture production, when transportation or market infrastructure are affected, land is seized or resources are destroyed, or the violence forces displacement from home (FAO, 2017). In addition to impacting food systems, conflict can also impact the economy, driving up food prices and making it difficult to buy necessary foods (FAO et al., 2017). In areas of severe violence, it may be difficult to deliver humanitarian assistance to address undernutrition (FAO, World Food Programme [WFP], & European Union [EU], 2018).

Source: FAO, WFP, & EU, 2018
Political instability. In countries facing political instability, the resulting decline of the economy reduces the value of the country’s currency, leading to higher food prices and less nutritious food available for purchase (FAO, WFP, & EU, 2018). The loss of jobs in a declining economy also impacts people’s ability to afford food, as income declines as well (FAO, WFP, & EU, 2018). Countries like the Democratic Republic of Congo, South Sudan, Yemen and Venezuela are examples of countries in which political instability is currently affecting food security (FAO, WFP, & EU, 2018).
Food and agricultural policy. A lack of adoption of more productive technologies for agriculture in lower-middle-income countries contributes to large differences in amount of crops produced when compared with upper income countries (FAO, 2017). Within regions, the gap between potential crop yield and actual crop yield can be as large as 76 percent, as seen in Sub-Saharan Africa (FAO, 2017).
Also, past agricultural practices implemented to increase crop yield have unintended consequences in the form of land and soil degradation, and using up or polluting the available groundwater (FAO, 2017). This then affects future capacity for food production, as these resources have been permanently depleted (FAO, 2017). However, more countries are beginning to adopt “conservation agriculture,” where various strategies are used to prevent the rapid depletion of scarce natural resources (FAO, 2017).
Climate change. Throughout the previous 30 years, natural disasters have become increasingly common (FAO, 2017). Unstable weather patterns can lead to drought – in 2016, El Niño was responsible for conditions of severe food insecurity for 20 million people (FAO, WFP, & EU, 2018). On the other extreme, hurricane and cyclone seasons have produced more powerful storms, causing damage to livelihoods, agricultural production and local market prices, in countries in the Caribbean and Asia (FAO, 2017). In agricultural-driven areas, especially in parts of Africa (Somalia, southeastern Ethiopia, and countries in West Africa), drought has driven economic, food production and political stability crises (FAO, WFP, & EU, 2018). For countries facing prolonged conditions or yearly disasters, undernutrition worsens, as there is little time for recovery (FAO, 2017).
The ecological impacts of climate change can affect the emergence or re-emergence of diseases on a larger scale, especially those with vectors (like mosquitoes and fleas) that thrive in warm humid environments (FAO, 2017). Disease caused by these vectors can prolong the cycle of malnutrition (FAO, 2017).

Source: FAO, WFP, & EU, 2018
Revised May 25, 2018, with the assistance of Crystal Lam, George Washington University, MPH candidate
Bibliography
Black, R. E., Allen, L. H., Bhutta, Z. A., Caulfield, L. E., De Onis, M., Ezzati, M., … & Maternal and Child Undernutrition Study Group. (2008). Maternal and child undernutrition: global and regional exposures and health consequences. The lancet, 371(9608), 243-260. (Article access is free but will require registration) Accessed September 2016.
Black, R. E., R. Laxminarayan, M. Temmerman, and N. Walker, editors. 2016. Reproductive, Maternal, Newborn, and Child Health. Disease Control Priorities, third edition, volume 2. Washington, DC: World Bank. doi:10.1596/978-1-4648-0348-2. Accessed May 2018.
Black, R. E., Morris, S. S., & Bryce, J. (2003). Where and why are 10 million children dying every year?. The lancet, 361(9376), 2226-2234. Accessed September 2016.
Black, R. E., Victora, C. G., Walker, S. P., Bhutta, Z. A., Christian, P., De Onis, M., … & Uauy, R. (2013). Maternal and child undernutrition and overweight in low-income and middle-income countries. The lancet, 382(9890), 427-451. Retrieved from http://www.thelancet.com/journals/lancet/article/PIIS0140-6736%2813%2960937-X/abstract (The article is available free of charge, but you will be required to register with Lancet). Accessed September 2016.
Bryce, J., Boschi-Pinto, C., Shibuya, K., Black, R. E., & WHO Child Health Epidemiology Reference Group. (2005). WHO estimates of the causes of death in children. The Lancet, 365(9465), 1147-1152. Accessed September 2016.
Center for Research on the Epidemiology of Disasters. (2013). “People affected by conflict: Humanitarian needs in numbers.” Retrieved from http://cred.be/sites/default/files/PAC2013.pdf. Accessed September 2016.
Food and Agriculture Organization. (2008). An introduction to the basic concepts of food security. Retrieved from http://www.fao.org/docrep/013/al936e/al936e00.pdf. Accessed June 2017.
Food and Agriculture Organization of the United Nations. (2017). The future of food and agriculture: Trends and challenges. Retrieved from http://www.fao.org/3/a-i6583e.pdf. Accessed May 2018.
Food and Agriculture Organization, International Fund for Agricultural Development, World Food Program. (2015). “The state of food insecurity in the world 2015. Strengthening the enabling environment for food security and nutrition.” Rome: FAO.
Food and Agriculture Organization, International Fund for Agricultural Development, UNICEF, World Food Programme, & WHO. (2017). The state of food security and nutrition in the world 2017: Building resilience for peace and food security. Retrieved from http://www.fao.org/3/a-i7695e.pdf. Accessed May 2018.
Food and Agriculture Organization, World Food Programme, & European Union. (2018). Global report of food crises 2018. Retrieved from http://www.fao.org/fileadmin/user_upload/fsin/docs/global_report/2018/GRFC_2018_Full_report_EN.pdf. Accessed May 2018.
Institute of Development Studies. (n.d.) “Hunger and Nutrition Commitment Index.” Retrieved from http://www.hancindex.org/. Accessed September 2016.
International Food Policy Research Institute. (2014). 2014 Global Food Policy Report. Accessed September 2016.
International Food Policy Research Institute. (2015). 2015 Global Hunger Index. Retrieved from https://www.ifpri.org/publication/2015-global-hunger-index-armed-conflict-and-challenge-hunger. Accessed September 2016.
International Food Policy Research Institute. (2016). 2016 Global Hunger Index. Retrieved from http://www.ifpri.org/publication/2016-global-hunger-index-getting-zero-hunger. Accessed December 2016.
National Research Council. (2006). Food Insecurity and Hunger in the United States: An Assessment of the Measure. Washington, DC: The National Academies Press. https://doi.org/10.17226/11578. Accessed May 2018.
Population Reference Bureau. (2016). “2015 World Population Data Sheet.” Retrieved from http://www.prb.org/pdf15/2015-world-population-data-sheet_eng.pdf. Accessed September 2016.
Rosen, S., Thorne, K., & Meade, B. (2016). International food security assessment, 2016-26. Economic Research Service, United States Department of Agriculture. Accessed December 2016.
The World Bank. (2013). “The State of the World’s Poor: Where are the Poor and where are they the Poorest?”http://www.worldbank.org/content/dam/Worldbank/document/State_of_the_poor_paper_April17.pdf Accessed September 2016.
The World Bank. (2016). Poverty website. Retrieved from http://www.worldbank.org/en/topic/poverty and the Overview page http://www.worldbank.org/en/topic/poverty/overview. Accessed September 2016.
The World Bank. (2016). Taking on Inequality. Poverty and Shared Prosperity 2016. Retrieved from https://openknowledge.worldbank.org/bitstream/handle/10986/25078/9781464809583.pdf. Accessed May 2018.
United Nations High Commissioner for Refugees. (2016). “Global trends: Forced displacement in 2015.” Retrieved from https://s3.amazonaws.com/unhcrsharedmedia/2016/2016-06-20-global-trends/2016-06-14-Global-Trends-2015.pdf. Accessed December 2016.
UNICEF. (2015, December 23). Severe acute malnutrition. Retrieved from https://www.unicef.org/nutrition/index_sam.html. Accessed May 2018.
UNICEF, World Health Organization, & The World Bank. (2014a). “Levels and trends in child malnutrition.” Retrieved from http://www.who.int/nutgrowthdb/estimates2013/en/. Accessed September 2016.
UNICEF, World Health Organization, & The World Bank. (2014b). “Summary of key facts about the 2013 joint malnutrition estimates.” Retrieved from http://www.who.int/entity/nutgrowthdb/summary_jme_2013.pdf?ua=1. Accessed September 2016.
UNICEF, World Health Organization, & The World Bank. (2018, May 14). Levels and trends in child malnutrition. UNICEF / WHO / World Bank Group Joint Child Malnutrition Estimates Key findings of the 2018 edition. Retrieved from http://data.unicef.org/wp-content/uploads/2018/05/JME-2018-brochure-.pdf. Accessed May 2018.
Victora, C. G., Adair, L., Fall, C., Hallal, P. C., Martorell, R., Richter, L., … & Maternal and Child Undernutrition Study Group. (2008). Maternal and child undernutrition: consequences for adult health and human capital. The lancet, 371(9609), 340-357. Retrieved from http://www.ncbi.nlm.nih.gov/pmc/articles/PMC2258311/. Accessed September 2016.
World Health Organization. (n.d.). Comparative Quantification of Health Risks: Childhood and Maternal Undernutrition. Retrieved from http://www.who.int/publications/cra/en/. Accessed September 2016.
World Health Organization. (n.d.). “Micronutrient Deficiencies.” Retrieved from http://www.who.int/nutrition/topics/micronutrients/en/. Accessed September 2016.
World Health Organization. (n.d.). WHO Global Database on Child Growth and Malnutrition. Retrieved from http://www.who.int/nutgrowthdb/en/. Accessed September 2016.
-
 World Hunger Education
Service
P.O. Box 29015
Washington, D.C. 20017 -