


Hunger in America: United States Hunger and Poverty Facts
Editorial Note!! This is an older version of our fact sheet. To access the latest information, see United States Hunger Facts and Statistics.
United States hunger and poverty statistics, food deserts, and principal programs to reduce hunger and poverty. Also see:
- United States hunger and poverty news
- Hunger Quiz: How many people are very food insecure in the United States?
- Hunger Quiz: Hunger in the United States and the U.S. food system

Hunger in the United States
The estimated percentage of U.S households that were food insecure in 2016 was 12.3%. Though relatively unchanged from 12.7% in 2015, food insecurity has decreased from 14.9% in 2011. However, it is still above the estimated percentage of food insecurity of 11.1%, which existed pre-recession (2008) in U.S. households (Coleman-Jensen, Rabbitt, Gregory, Singh, 2017).
- In 2016, 87.7 % of U.S. households were food secure throughout the year.
- In 2016, 12.3% of U.S. households (15.6 million households) were food insecure. Food insecure households are those where people had difficulty providing food to all members of the household due to limited resources.
- 4.9% of U.S. households (6.1 million households) had very low food security. In households with very low food security, food intake is decreased, and normal eating patterns are disturbed for some members of the household at times during the year.
- 8% of U.S. households with children (3.1 million households) were food insecure. These households were unable to provide adequate nutritious food for their children at some point during the year.
- In 0.8% of households, both adults and children experienced very low food security. 298,000 households with children experienced very low food insecurity in 2016.
- Food insecurity in households with children headed by a single parent, or households with single women or single men living alone, or households with a Black or Hispanic head of family, or households in principal cities and non-metropolitan areas is higher than the national average for households with incomes near or below the federal poverty limit.
- The prevalence of food insecurity varies from state to state, ranging from 8.7% in Hawaii to 18.7% in Mississippi in 2014-2016. Based on data from 2016, the 10 hungriest states in the U.S. are Mississippi, Arkansas, Louisiana, Alabama, Kentucky, Ohio, Oregon, North Carolina, Maine, and Oklahoma.
- The average food-secure households spent 29% more for food than the average food-insecure household of the same size and composition. The estimates include food purchases made with Supplemental Nutrition Assistance Program (SNAP), formerly known as food stamps, benefits.
- About 59% of food-insecure households in the survey reported that in the previous month they had participated in one or more of the three largest federal nutrition assistance programs: SNAP, Special Supplemental Nutrition Program for Women, Infants, and Children (WIC), and/or the National School Lunch Program.
Note: In 2006, the U.S. Government eliminated references to hunger in their definitions, but kept various categories of food insecurity. This did not result in any changes in what was measured. Very low food security (described prior to 2006 as “food insecurity with hunger”) means that at times throughout the year, the food intake of household members was reduced and their normal eating patterns were disrupted due to lack of money and other resources. This means that those experiencing very low food security experienced hunger–“the uneasy or painful sensation caused by want of food” (Oxford English Dictionary, 1971). For days each year, these households had to skip meals or eat smaller than typical amounts of food due to lack of funds and resources.
(Source: Coleman-Jensen et al., 2017)
Food Deserts
Food deserts are defined as parts of the country with an unavailability of fresh fruits, vegetables, and other healthy whole foods (USDA). These areas generally lack grocery stores, farmers markets, and other healthy food providers. Households in rural and low-income areas are often sites for food deserts, as these areas lack large retail food markets. These areas might have convenience stores, but they rarely carry healthy foods.

Poverty in the United States
The official poverty measure published by the United States Census Bureau shows that:
- The official poverty rate was 12.7% in 2016, down 0.8 percentage points from 13.5% in 2015. This is the second consecutive annual decline in poverty. Since 2014, the poverty rate has fallen 2.1 percentage points from 14.8 % to 12.7%.
- There were 40.6 million people in poverty in 2016, 2.5 million fewer than in 2015 and 6 million fewer than in 2014.
- The poverty rate in 2016 (12.7%) was not significantly higher than the poverty rate in 2007 (12.5%), the year before the most recent recession.
- For most demographic groups, the number of people in poverty decreased from 2015.
- Adults aged 65 and older were the only population group to experience an increase in the number of people in poverty.
- Between 2015 and 2016, the poverty rate for children under age 18 declined from 19.7% to 18%.
- The poverty rate for adults aged 18-64 declined from 12.4% to 11.6%. The poverty rate for adults aged 65 and older was 9.3% in 2016, higher but not statistically different from the rate in 2015.
(Source: Semega, 2017)
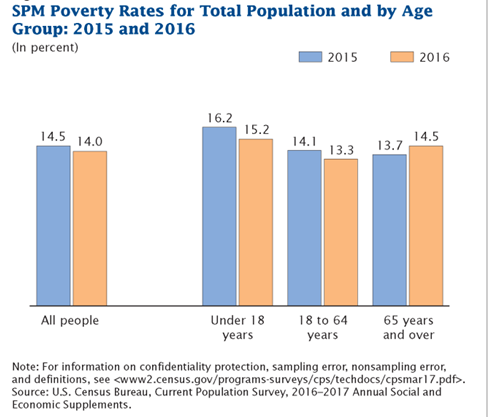
The supplemental poverty measure (SPM) was coined by the U.S. Census Bureau in 2011. It is the official poverty measure which takes into account the many government programs designed to help low income families and individuals. These programs are not included in the official poverty measure (Fox, 2017).
- The overall SPM rate was 14% in 2016. It was slightly lower than the 14.5% rate in 2015.
- SPM rates were down for children under age 18 and adults aged 18 to 64.
- SPM rates for individuals aged 65 and older went up, from 13.7% in 2015 to 14.5% in 2016.
- The SPM rate for 2016 was 1.3 percentage points higher than the official poverty rate of 12.7%.
- Social Security continued to be the most important anti-poverty program, moving 26.1 million individuals out of poverty.
- Refundable tax credits moved 8.1 million people out of poverty, representing an important safety net for many people.
Taking account of other non-cash benefits also lowered poverty rates. For example, SNAP benefits lowered the overall poverty rate by 1.4 percentage points or 4.6 million people (Renwick and Fox, 2016).
Examples of Programs that Address Hunger and Poverty in the United States
Hunger
59% of food-insecure households in the 2015 survey reported that in the previous month, they had participated in one or more of the three largest federal food and nutrition assistance programs (Coleman-Jensen et al., 2017). The programs are the Supplemental Nutrition Assistance Program (SNAP), the relatively new name for the former food stamp program, the Special Supplemental Nutrition Program for Women, Infants, and Children (WIC), and the National School Lunch Program.
SNAP/Food stamps
- SNAP provides nutritional support for low-wage working families, low-income seniors, and people with disabilities living on a fixed income.
- In fiscal year (FY) 2016, about 44.2 million people living in 21.8 million U.S. households participated in the United States Department of Agriculture (USDA) Supplemental Nutrition Assistance Program, on average, per month.
- Two thirds of SNAP participants were children, elderly, or had disabilities.
- The average gross income for all SNAP households was $813 per month for FY 2016.
- The average SNAP household received $249 in monthly benefits.
- SNAP has had a powerful anti-poverty effect. When SNAP benefits are added to gross income, 10% of SNAP households move above the poverty line. The impact was greater for the poorest households, moving 12% of the SNAP households from below 50% of the poverty line to above 50% of the poverty line.
(Source: Lauffer, 2017)
WIC (Special Supplemental Nutrition Program for Women, Infants and Children)
- WIC provides nutritious foods, nutrition education, and referrals to health and other social services to low-income pregnant, postpartum, and breastfeeding women, as well as infants and children up to age 5 who are at nutritional risk. WIC participants receive checks or vouchers to purchase nutritious foods each month, including infant cereal, iron-fortified adult cereal, vitamin C-rich fruit or vegetable juice, eggs, milk, cheese, peanut butter, dried and canned beans/peas, and canned fish. Other options such as fruits and vegetables, baby foods, and whole wheat bread were recently added to the list.
- 3 million infants and children under five and 2 million women received WIC benefits monthly in 2017.
- The cost of the program was approximately $5.6 billion in FY 2017. A participant family’s income must fall below 185% of the U.S. Poverty Income Guidelines (in 2018, $46,435 for a family of four). Eligibility is also granted to participants in other benefit programs, such as SNAP, Medicaid, or Temporary Assistance for Needy Families (TANF). Funding: WIC is a federal grant program; Congress authorizes a specific amount of funding each year for program operations.
(Source: CBPP)
National School Lunch Program
- The National School Lunch Program is open to all children enrolled in a participating school. Approximately 95% of public schools participate. During the 2015-16 school year, 21.6 million children in more than 98,000 schools and residential childcare institutions participated in the National School Lunch Program.
- On a typical school day, around two-thirds of the total children receive free or reduced price lunches.
- Any child at a participating school may purchase a meal through the National School Lunch Program. Household income determines if a child is eligible to receive free or reduced price meals, or must pay most of the cost. To receive free lunch, household income must be at or below 130% of the federal poverty level; for reduced price lunch, income must be between 130-185% of the poverty level.
- Reimbursable meals must meet federal nutrition standards. National School Lunch Program lunches provide one-third or more of the recommended levels for key nutrients.
- Studies show that proper nutrition improves a child’s behavior, school performance, and overall cognitive development. A healthy eating environment teaches children good nutrition and the elements of a proper diet, which can have positive effects on children’s eating habits and physical well-being throughout life.
USDA Food Assistance for Disaster Relief
-
- There are also U.S. government programs that help Americans after a disaster, such as a hurricane or flood. The USDA’s Food and Nutrition Service (FNS) coordinates with state, local, and volunteer organizations (such as the Red Cross and the Salvation Army) to: 1)Provide food for shelters and other mass feeding sites; 2) Distribute food packages directly to households in need in limited situations; 3)Issue Disaster Supplemental Nutrition Assistance Program (D-SNAP) benefits.
- Watch this video to learn more.
(Sources: FRAC, 2018; New America Foundation; USDA FNS: National School Lunch Program, Food Assistance for Disaster Relief)
Poverty
Three of the principal programs that provide income and other assistance for people with low incomes are the minimum wage, the Earned Income Tax Credit (EITC), and the Temporary Assistance to Needy Families (TANF) program. Other programs, not discussed here, include Medicaid and the State Children’s Health Insurance Program (SCHIP), as well as Social Security and Medicare for older people.
Minimum wage
- The United States has enacted a minimum wage (as do some individual states) that tries to establish a floor for what firms can pay as a wage. The current federal minimum wage is $7.25 per hour. As of January 2018, 29 states and District of Columbia have minimum wages above the federal minimum wage.
- Nearly 9 million children in working families lived below the official poverty line (about $24,000 annually for a family of four) in 2016.
- The minimum wage is not indexed for inflation. Thus, its value over the years has been diminished substantially, as increases in the minimum wage have not kept up with inflation.
- The direct wage for a tipped employee is $2.13 in wages if the combined amount with the tips received equals the federal minimum wage.
(Source: CBPP. See also: Wikipedia)
The Earned Income Tax Credit (EITC)
- The EITC is the mechanism through which, by filing a tax return, low-income people and families can receive an income supplement. It reduces poverty directly by supplementing the earnings of low-wage workers, and is designed to encourage and reward work.
- The amount of EITC depends on a recipient’s income, marital status and number of children.
- During the 2016 tax year, the average EITC was $3,176 for a family with children (boosting wages by about $265 a month), compared with $295 for a family without children.
- In 2016, the EITC lifted about 5.8 million people out of poverty, including about 3 million children.
- One way the EITC reduces poverty is by supplementing the earnings of minimum-wage workers. At the federal minimum wage current level, a two-parent family with two children with a full-time, minimum-wage worker can move above the poverty line only if it receives the EITC as well as SNAP benefits.
(Source: CBPP)
Temporary Assistance to Needy Families (TANF)
- In 1996, TANF replaced the Aid to Families with Dependent Children program, which had been in existence since 1935.
- The Temporary Assistance for Needy Families (TANF) block grant, created by the 1996 welfare law, was designed to provide a temporary safety net to low-income families. States have discretion on how to use the funds.
- The number of TANF recipients has fallen by 60% from 1996, the last year of the Aid to Dependent Children program and the beginning of TANF, to 2014.
- TANF benefits have lost a fifth of their value since 1996 in most states, and leave families far below the poverty line (CBPP).
- In 2016, for every 100 families in poverty, just 23 families received TANF cash assistance.
- In 2017, the ratio has decreased to 10 or less, for every 100 families in poverty; 10 or fewer receive TANF cash assistance.
- This decline is due to factors such as the five-year time limitation on benefits, declining real levels of funding, some increase in the number of single parents who work, and an inability of families to meet the regulations.
- Studies of families that stop receiving TANF assistance show that 60% of former recipients are employed—typically at poverty-level salaries between $6 and $8.50 an hour—while 40% are not employed (See CBPP TANF and CBPP TANF Chartbook).
Examples of Non-Governmental Programs that Address Hunger and Poverty in the United States
AARP and AARP Foundation
The AARP and AARP Foundation represent a charity which fights hunger in food insecure populations. 37 million people who are 50 years old or older have come together to address hunger through community involvement addressing anti-hunger programs, enrollment of older adults for SNAP, and research and development of sustainable solutions.
Feeding America
Feeding America is an extensive network of more than 200 food banks nationwide, serving 37 million including children and seniors through local partnerships such a soup kitchens, food pantries, after school programs and emergency shelters.
Meals on Wheels
The Meals on Wheels Association of America is a community based program, which provides approximately 1 million meals a day to seniors across the country, either by direct delivery to homebound seniors and adults with disabilities or congregational meals at community centers or long-term care facility centers.
(Updated September 2018 with the assistance on Zainab Arif, MPH Candidate, George Washington University)
References
Coleman-Jensen, Alisha, Gregory, Christian A., Rabbit, Matthew P., and Singh, Anita. (2017). Household Food Security in the United States in 2016, ERR-237, U.S. Department of Agriculture, Economic Research Service
Centers for Disease Control & Prevention. (2011). Healthy Places: Healthy Food Environment. Retrieved from https://www.cdc.gov/healthyplaces/healthtopics/healthyfood_environment.htm
Center on Budget and Policy Priorities (CBPP). (2016). Policy Basics: Introduction to the Earned Income Tax Credit. Retrieved from http://www.cbpp.org/cms/index.cfm?fa=view&id=2505 Accessed September 18, 2016.
Center on Budget and Policy Priorities (CBPP). (2017). Policy Basics: Special Supplemental Nutrition Program for Women, Infants, and Children. Retrieved from https://www.cbpp.org/research/policy-basics-special-supplemental-nutrition-program-for-women-infants-and-children?fa=view&id=5268
Fox, Liana. (2017, September 21). The Supplemental Poverty Measure: 2016. Retrieved from https://www.census.gov/library/publications/2017/demo/p60-261.html
Food and Research Action Center. Retrieved from http://frac.org/programs/national-school-lunch-program Accessed September 5, 2018.
Lauffer, Sarah. (2017). Characteristics of USDA Supplemental Nutrition Assistance Program Households: Fiscal Year 2016.
Renwick, Trudy and Liana Fox. (2016). The Supplemental Poverty Measure: 2015. Retrieved from https://www.census.gov/content/dam/Census/library/publications/2016/demo/p60-258.pdf Accessed September 30, 2016.
Semega, J. L. (2017, September 12). Income and Poverty in the United States: 2016. Retrieved from https://www.census.gov/library/publications/2017/demo/p60-259.html
United States Department of Agriculture, Food and Nutrition Service. (2014). National School Lunch Program: Background and Development. Retrieved from http://www.fns.usda.gov/nslp/history Accessed September 30, 2016
USDA Defines Food Deserts. (n.d.). Retrieved from http://americannutritionassociation.org/newsletter/usda-defines-food-deserts
United States Department of Agriculture, Food and Nutrition Service. WIC Program. Retrieved from https://www.fns.usda.gov/wic/ Accessed September 5, 2018.
Wikipedia. Earned Income Tax Credit. Retrieved from http://en.wikipedia.org/wiki/Earned_income_tax_credit Accessed September 30, 2016.
Wikipedia. Factor price equalization. Retrieved from http://en.wikipedia.org/wiki/Factor_price_equalization Accessed September 30, 2016.
Wikipedia. Minimum wage. Retrieved from http://en.wikipedia.org/wiki/Minimum_wage Accessed September 30, 2016.
Wikipedia. Supplemental Nutrition Assistance Program. Retrieved from http://en.wikipedia.org/wiki/Supplemental_Nutrition_Assistance_Program Accessed September 30, 2016.
-
 World Hunger Education
Service
P.O. Box 29015
Washington, D.C. 20017 -