 |
|||
| DEPARTMENTS | |||
|
|
|||
|
|
|||
|
|
|||
|
|
|||
|
|
|||
|
|
|||
|
|
|||
| YOU CAN!... | |||
|
|
|||
|
|||
|
|||
| MORE ABOUT HUNGER NOTES |
|||
|
|
|||
|
|
|||
|
|
|||
|
|||
|
|||
If the current U.S. tax cuts are extended as the President proposes, the top 1% of U.S. households will receive 30% of the benefits
(February 5, 2006) Under current law, nearly all provisions of the 2001 and 2003 tax cuts are scheduled to expire at the end of 2010. The President’s 2007 budget calls for making these tax cuts permanent.
The enacted tax cuts and their extension carry a high cost. This raises the question: how would the large sums involved be distributed among different income groups?
The Urban Institute-Brookings Institution Tax Policy Center has produced estimates of how the benefits of the income and estate tax reductions enacted in 2001 and 2003 will be distributed among households at different income levels in coming years, if these tax cuts are extended. [1] (The estimates assume that relief from the Alternative Minimum Tax is continued. Without extension of AMT relief, the AMT would cancel out a substantial portion of the 2001 and 2003 tax cuts; see the discussion on pages 6-7.)
|
Table 1: Distribution of the Tax Cuts, 2008-2017 |
||
| Income Group |
Dollar Amount (In Billions of Dollars) |
Percentage Shares |
| Lowest 20 percent | $15 | 0% |
| Second 20 percent | 147 | 4% |
| Middle 20 percent | 263 | 8% |
| Fourth 20 percent | 465 | 14% |
| Top 20 percent | 2,505 | 74% |
| Total | 3,404 | 100% |
| Top 1 percent | 1,038 | 31% |
| Above $1 million | 739 | 22% |
|
Source: CBPP
calculations based on Joint Tax Committee, CBO,
and Tax Policy Center data. * Less than 0.5 percent |
||
Estimates from the Congressional Budget Office and the Joint Committee on Taxation indicate that the cost of the tax-cut provisions the Tax Policy Center has analyzed would be $3.4 trillion over the 2008-2017 period, if these provisions are extended. Applying the Tax Policy Center estimates of the share of the tax cuts that would go to each income group to the CBO/Joint Tax Committee estimates of the tax cuts’ cost shows:
- From 2008 through 2017, households with annual incomes of more than $1 million — a group that comprises the highest income 0.3 percent of the population — would receive $739 billion in tax cuts. This represents 22 percent of the total value of the tax cuts over the period.
- More than $1 trillion in tax cuts would go to the top 1 percent of households, a group with annual incomes above $400,000 in 2007. The highest income 1 percent of households thus would receive nearly one third of the tax cuts’ total value.
- The bottom 60 percent of households would receive 12 percent of the tax cuts’ value, or well under half the amount that would go to the top 1 percent. (See Table 1; for year-by-year detail, see the appendix tables.)
The Distribution of the Tax Cuts When They Are Fully in Effect
Fiscal year 2012 is the first year in which the costs of choosing to extend the 2001 and 2003 tax cuts would be fully felt. It is informative to consider how the benefits of the tax cuts would be distributed in that year.
- In fiscal year 2012, the cost of the income and estate tax cuts examined by the Tax Policy Center would amount to $333 billion.
- Taxpayers with incomes above $1 million would receive tax cuts worth $73 billion, a little over one fifth of the tax cuts’ total value in 2012. The average tax cut per household for this group would be $162,000, according to Tax Policy Center estimates.
- The top 1 percent of the population would receive tax cuts totaling $103 billion, close to one third of the tax cuts’ total value. These households would receive tax cuts averaging $67,000.
- In contrast, the 20 percent of households in the middle fifth of the income scale would receive tax cuts worth $26 billion in 2012. This is only one fourth of the amount going to the top 1 percent of households, despite the fact that 20 times as many households are in the middle fifth of the income scale as are in the top 1 percent. The average tax cut for households in this group would be $840.
Other measures also show that the benefits of the tax cuts would be very unevenly distributed. Many economists believe the best way to assess the progressivity or regressivity of a tax cut is to compare the percentages by which the tax cut increases the after-tax incomes of different groups of households. This approach tends to make tax cuts going to low-income households appear relatively large, since a tax cut of a specific dollar amount will raise the after-tax income of a low-income household by a much larger percentage than it will raise the after-tax income of a high-income household.
Even by this measure, the benefits conferred by the 2001 and 2003 tax cuts are much greater for high-income households than for low- and middle-income households. The Tax Policy Center estimates show that in 2012, the tax cuts will boost the after-tax incomes of households with annual pre-tax incomes above $1 million by 7.5 percent on average. In contrast, the tax cuts will raise the after-tax incomes of households in the middle quintile by 2.3 percent and raise the after-tax incomes of households in the bottom quintile by less than 1 percent (see Table 2). Thus, even if the tax cuts are measured relative to households’ incomes, they are worth much more to high-income households than to those in the middle or bottom of the income scale.
|
Table 2: Distribution of the Tax Cuts in 2012 |
||
| Income Group | Average Tax Cut in Dollars |
Percent Increase in After-Tax Income |
| Lowest 20 percent | $45 | 0.5% |
| Second 20 percent | 470 | 2.1% |
| Middle 20 percent | 840 | 2.3% |
| Fourth 20 percent | 1,500 | 2.4% |
| Top 20 percent | 8,000 | 4.6% |
| Top 1 percent | 67,000 | 6.8% |
| Above $1 million | 162,000 | 7.5% |
| Source: Tax Policy Center | ||
Moreover, these estimates, which show all groups of households receiving at least some small benefit from the tax cuts, do not take into account the fact that the tax cuts ultimately must be paid for. As former Federal Reserve Chairman Alan Greenspan has warned, “If you’re going to lower taxes, you shouldn’t be borrowing essentially the tax cut… [T]hat over the long run is not a stable fiscal situation.”[2] Tax Policy Center data indicate that, even if the enacted tax cuts and their extension eventually were paid for through a balanced package of program cuts and progressive tax increases (rather than solely through benefit cuts), the bottom four fifths of households would likely lose, on average, from the combination of the tax cuts and the measures needed to finance them. That is, once the need to pay for the tax cuts is taken into account, the 2001 and 2003 “tax cuts” are best seen as net tax cuts for the top 20 percent of households, as a group, financed by net tax increases or benefit reductions for the remaining 80 percent of households, as a group.[3]
Putting the Cost of the Tax Cuts in Context
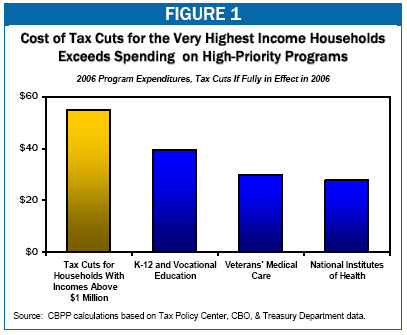
When the tax cuts are fully in effect, the cost of the tax cuts going to the very highest income households will be greater, in today’s terms, than the amounts spent on various high-priority programs.
- In 2006 terms, the cost of tax cuts for households with annual incomes above $1 million will exceed what the federal government spent last year on K-12 and vocational education. It similarly will exceed the federal resources dedicated to hospital and other medical care for veterans, as well the resources provided for medical research conducted by the National Institutes of Health (see Figure 1).
- The cost of tax cuts for the highest-income 1 percent of households will exceed the entire 2006 budget of the Department of Homeland Security. It similarly will exceed the entire 2006 budget of the Department of Veterans’ Affairs. And it also will be greater than the combined budgets of the Departments of Housing and Urban Development, Energy, and the Environmental Protection Agency.
The Cost of the Tax Cuts Relative to the Savings From Program Cuts
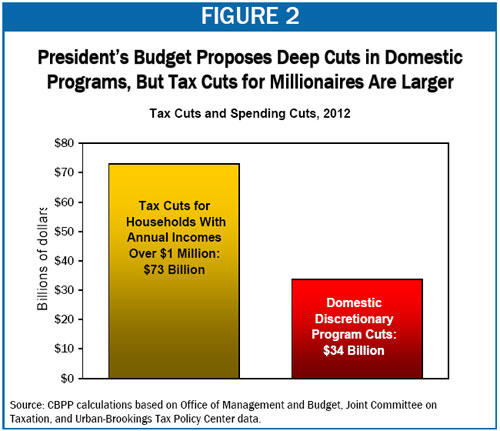
The President’s budget proposes to make permanent the tax cuts enacted in 2001 and 2003. At the same time, the President has argued that his goal of balancing the budget by 2012 will require substantial cuts to domestic programs. The budget proposes funding cuts amounting to almost $150 billion over the next five years in an array of domestic non-entitlement programs, including education programs, veterans’ programs, environmental programs, and others.
The savings that would be achieved by these cuts in each of the next five years would be less than the cost of the tax cuts just for households with incomes above $1 million. In 2012, the President’s budget would cut domestic programs by $41 billion; the cost of tax cuts for households with incomes above $1 million would be $73 billion (see Figure 2). In essence, the budget would use the resources from these benefit cuts, which would affect millions of low- and middle-income families, to defray a small portion of the costs of the President’s tax cuts, which are providing very large tax benefits to the wealthiest families in the country.
As noted above, when the Tax Policy Center evaluated the distribution of the tax cuts in conjunction with possible approaches to paying for them, it found that most low- and middle-income families would likely lose, on net, from the combination of tax cuts and offsetting program cuts and tax increases. A similar outcome would almost certainly follow if the President’s tax cuts were extended and then ultimately paid for largely or entirely through domestic program cuts of the kind recommended in the President’s budget.
Aviva Aron-Dine is a Policy Analyst with the Center on Budget and Policy Priorities. This article was originally published by CBPP and may be viewed at http://www.cbpp.org/2-5-07tax.htm
End Notes:
[1] The Joint Committee on Taxation issued estimates of the distribution of the income tax cuts enacted in 2001, but these estimates extended only through 2006. See Joint Committee on Taxation, “Distributional Effects of the Conference Agreement for H.R. 1836,” JCX 52-01, May 26, 2001. There are no other government estimates of this matter.
[2] Chairman Alan Greenspan in “US Representative Jim Nussle (R-IA) Holds Hearings on the Budget and the Economy,” FDCH Political Transcripts, September 8, 2004.
[3] See William Gale, Peter Orszag, and Isaac Shapiro, “The Ultimate Burden of the Tax Cuts: Once the Tax Cuts Are Paid for, Low- and Middle-Income Households Likely to Be Net Losers, on Average,” Center on Budget and Policy Priorities, June 2, 2004.